|
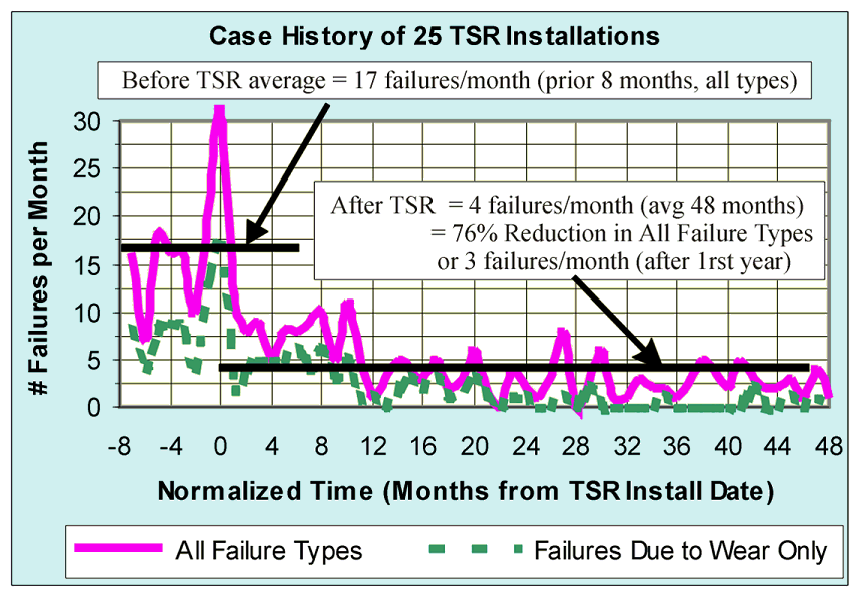
| TABLE 1: Case History of 25 Wells installed with the TSR for 4 years |
| . |
| THEREFORE, THE TUBING SAVER ROTATOR (TSR) IS APPLICABLE FOR THE AVERAGE WELL AND NOT JUST PROBLEM WELLS. |
| The average run time between failures was improved from 1.5 months (8 month average) to 6.1 months per well (48 month average) with further improvement to 9 months per well 1 year after installation. This improvement yielded a 100% rate of return and a 3 month payout. In addition, this 76% reduction (4.1 times the life) is for all failure types (not just wear-related, but also includes rod parts, stuck pumps, etc.). One could assume that the TSR could extend the life between failure repairs by 4 to 6 times. The savings generate around 40% to 100% rate of returns for wells that fail at least once every two years or more often (assuming the TSR cost is equal to one repair cost). |
| Experiment was performed in a large oil field comprised of 1200 rod-pumping oil producers with the objective to reduce failure frequency. We picked twenty-five of the worst performing wells and installed them with the TSR/SJ equipment from 1996 to 1998. Results indicating significant improvements can be seen in Table 1 below. |
| . |
| . |
| . |

| Engineering: |
| Sales: |
| . |
| . |


| . |
| . |